
What is a good DAT score?
Percentiles, class averages and the concordance table
There is no passing score. An Academic Average of 400 to 410 sits near the middle of all test takers, and 440 is at the 81st percentile. First-year dental students averaged about 434 in 2025-26, and published class averages center near 446 on the new scale and 21 on the old one, which the ADA's table puts at 440. A good score reaches the averages at your target schools.
- Average, all tests, 2025
- 408 Academic Average
- First-year average, 2025-26
- 434 (CODA survey)
- Published class median
- About 446 (22 schools)
- Old-scale class median
- 21, or about 440 (20 schools)
- 91st percentile
- 470 Academic Average

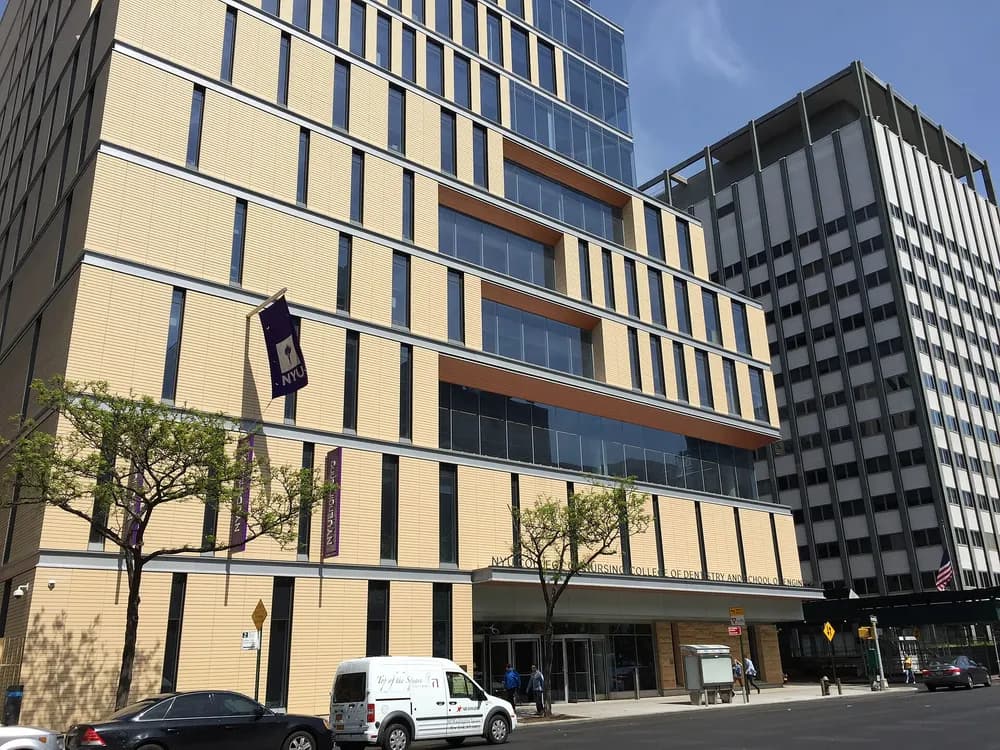


Photo: Kevin Albright · CC BY-SA 3.0 · cropped
Photo: Jgunaratne · Public domain · Photo: Beyond My Ken · CC BY-SA 4.0 · Photo: Beyond My Ken · CC BY-SA 4.0
What counts as a good DAT score?
There is no passing score. The American Dental Association (ADA) says each dental program decides what it accepts, so a good score is one that reaches the averages at the schools on your list. Most schools focus on the Academic Average, the mean of Biology, General Chemistry, Organic Chemistry, Quantitative Reasoning and Reading Comprehension. In the 2025-26 CODA survey, 63 of 76 schools called it very important.
As a working target, a 440 or 450 puts you near the middle of published class averages. Three measures agree on that area. The survey's first-year average is 434, the median across schools reporting on the new scale is about 446, and the old-scale median of 21 sits at 440 on the ADA's table.
| Academic Average | Where it sits | Examples |
|---|---|---|
| Below 390 | Under some published minimums | UT Health San Antonio asks for 390, Creighton 370 and Iowa 360. |
| 400 to 410 | Near the middle of all test takers: the 54th to 62nd percentile | The average across all tests in 2025 was 408. |
| 420 to 440 | The lower part of published class averages | UMKC 420, Western University 430, Indiana 440. |
| 440 to 460 | The middle of published class averages: the 81st to 88th percentile | Oregon Health & Science 444, Case Western 446.75, USC and West Virginia 450. |
| 470 and above | The higher published class averages: the 91st percentile and up | Florida 470, Penn 483.85. |
These bands are our reading of the figures below, not ADA categories. Percentiles are from the ADA's Table 2.
How the DAT score scale works
Since March 1, 2025 each score runs from 200 to 600 in 10-point steps, so you can earn a 440 or 450 but not a 447. A class average such as 483.85 has decimals because it is a mean of many students' scores. Scale scores are neither the number you got right nor percentiles, and equating lets scores from different test forms be compared.
Before that date the scale ran from 1 to 30. Both are valid, and schools have not all switched how they report class figures. Read the scale before you read the number.
| Score | All tests | First-time test takers | Repeaters |
|---|---|---|---|
| Academic Average | 407.84 | 413.9 | 396.3 |
| Survey of the Natural Sciences | 402.08 | 408.7 | 389.5 |
| Biology | 405.32 | 411.4 | 393.6 |
| General Chemistry | 398.76 | 404.9 | 387.0 |
| Organic Chemistry | 402.09 | 409.6 | 387.8 |
| Perceptual Ability | 406.84 | 410.7 | 399.4 |
| Quantitative Reasoning | 405.32 | 411.1 | 394.3 |
| Reading Comprehension | 427.69 | 432.5 | 418.5 |
From Tables 2 and 4 of the ADA's DAT User's Manual. Repeaters are a different group of people, so the gap does not show what a retake does to a score.
DAT percentiles: where each score sits among test takers
The ADA publishes percentile ranks for the new scale. A rank is the share of test takers who scored at or below that number, so a rank of 85 means 85% scored the same or lower.
| New score | Academic Average | Natural Sciences | Perceptual Ability | Quantitative | Reading |
|---|---|---|---|---|---|
| 340 | 15 | 17 | 18 | 18 | 18 |
| 360 | 25 | 27 | 27 | 28 | 29 |
| 380 | 39 | 39 | 39 | 41 | 43 |
| 390 | 47 | 47 | 46 | 47 | 49 |
| 400 | 54 | 53 | 52 | 54 | 56 |
| 410 | 62 | 61 | 59 | 61 | 63 |
| 420 | 69 | 67 | 65 | 67 | 69 |
| 430 | 75 | 73 | 71 | 73 | 74 |
| 440 | 81 | 79 | 76 | 78 | 79 |
| 450 | 85 | 83 | 81 | 82 | 83 |
| 460 | 88 | 87 | 84 | 85 | 86 |
| 470 | 91 | 89 | 88 | 88 | 89 |
| 480 | 94 | 92 | 90 | 91 | 91 |
| 490 | 96 | 94 | 93 | 93 | 93 |
| 500 | 97 | 95 | 94 | 94 | 94 |
| 520 | 99 | 97 | 97 | 96 | 95 |
| 540 | 100 | 99 | 98 | 98 | 96 |
From Table 2 of Understanding the New DAT Score Reporting Scale (ADA, updated January 29, 2025), which also lists every other score and the three science tests.
The same number means different things on different tests. A 440 is at the 81st percentile on the Academic Average but the 76th on Perceptual Ability. The Academic Average also bunches more tightly, because it averages five scores, so its ranks climb faster.
Those ranks come from a sample of attempts scored for the 2025 change. The ADA's Candidate Guide also points to the most recent norms in its User Manual. Adding up that table gives a tougher picture for 2025, by up to 8 points near the middle of the range.
| Academic Average | ADA percentile rank | 2025 tests at or below |
|---|---|---|
| 390 | 47 | 38.6% |
| 400 | 54 | 47.1% |
| 420 | 69 | 63.8% |
| 440 | 81 | 77.4% |
| 450 | 85 | 82.8% |
| 460 | 88 | 87.2% |
| 470 | 91 | 90.5% |
| 500 | 97 | 96.8% |
The last column is our own sum of Table 1 in the ADA's User Manual, covering March 1 to December 31, 2025. Rounding in that table can move a figure slightly.
The ADA concordance table: old 1 to 30 scores on the new scale
To compare an old score with a new one, find its row and the column for that test. The ADA calls each pair an approximate equivalent.
| Old score | Academic Average | Natural Sciences | Perceptual Ability | Quantitative | Reading |
|---|---|---|---|---|---|
| 15 | 330 | 340 | 310 | 340 | 300 |
| 16 | 350 | 360 | 340 | 360 | 320 |
| 17 | 370 | 380 | 360 | 380 | 340 |
| 18 | 390 | 400 | 390 | 400 | 360 |
| 19 | 410 | 410 | 410 | 420 | 370 |
| 20 | 420 | 430 | 430 | 430 | 390 |
| 21 | 440 | 450 | 450 | 450 | 410 |
| 22 | 460 | 460 | 470 | 460 | 430 |
| 23 | 470 | 480 | 500 | 480 | 450 |
| 24 | 490 | 500 | 520 | 500 | 470 |
| 25 | 510 | 520 | 550 | 510 | 490 |
| 26 | 520 | 530 | 580 | 520 | 510 |
| 27 | 540 | 550 | 580 | 540 | 550 |
| 28 | 560 | 560 | 590 | 580 | 550 |
| 29 | 580 | 580 | 600 | 590 | 560 |
| 30 | 600 | 600 | 600 | 600 | 580 |
From Table 1 of Understanding the New DAT Score Reporting Scale (ADA, updated January 29, 2025). Scores from 1 to 14 are in the ADA's table.
| Old score | Biology | General Chemistry | Organic Chemistry |
|---|---|---|---|
| 15 | 340 | 350 | 350 |
| 16 | 360 | 360 | 370 |
| 17 | 370 | 380 | 380 |
| 18 | 390 | 400 | 400 |
| 19 | 410 | 410 | 410 |
| 20 | 420 | 430 | 430 |
| 21 | 440 | 440 | 450 |
| 22 | 460 | 460 | 470 |
| 23 | 470 | 470 | 480 |
| 24 | 490 | 490 | 490 |
| 25 | 500 | 510 | 510 |
| 26 | 520 | 530 | 530 |
| 27 | 550 | 550 | 550 |
| 28 | 580 | 570 | 560 |
| 29 | 590 | 580 | 570 |
| 30 | 600 | 600 | 590 |
The ADA built the table by scoring more than 30,000 attempts under both systems, then matching scores that held similar positions in each distribution. ADEA AADSAS, the main application service, shows every applicant on the new scale, using the ADA's converted figures for older tests, so schools see one scale. The DTS Hub, the ADA's score site, still shows your old score as you earned it.
Why you should never convert a DAT score by arithmetic
The scales are not a simple multiple of each other. They were matched on position in the distribution, and each test has its own column. Any formula you try will be right in some places and wrong in others.
- Multiplying by 20 gives 400 for an old 20. The table says 420 on the Academic Average.
- Adding a set amount fails too. On the Academic Average, old 18 to 19 is 20 points, but old 19 to 20 is only 10.
- One old score has many new values. An old 26 is 520 on the Academic Average, 580 on Perceptual Ability and 510 on Reading Comprehension.
- Table rows cover whole numbers. A class mean of 23.1 is not a table row, so treat its equivalent as approximate.
You took the DAT in 2024 and earned an Academic Average of 22 and Perceptual Ability of 19. A school's page says its class averaged 450 on both.
Use the table, one column at a time. Your 22 becomes about 460 on the Academic Average, above that class figure. Your 19 becomes about 410 on Perceptual Ability, well below it. Multiplying by 20 would have put your Academic Average at 440, below the class figure when it is really above it, and your Perceptual Ability at 380, 30 points below the table's 410.
What DAT class averages look like at US dental schools
We checked every US dental school's own pages in September 2026. 22 report a class figure on the new scale, with a median of about 446 and a range of 420 to 484. 20 still use the old scale, with a median of 21. At least 30 publish none.
| School | Class | Published average | New scale |
|---|---|---|---|
| Penn | Class of 2030 | 483.85 | As published |
| Florida | Class of 2030 | 470 | As published |
| UTHealth Houston | DDS Class of 2030 | 470 (headline) | As published |
| LSU | 2026 entering class | 464 | As published |
| UNLV | Class of 2030 | 452.69 | As published |
| USC | DDS Class of 2030 | 450 | As published |
| West Virginia | Class of 2030 | 450 | As published |
| Case Western | Entering class of 2025 | 446.75 mean, 440 median | As published |
| Oregon Health & Science | DMD Class of 2030 | 444 | As published |
| Indiana | DDS Class of 2030 | 440 | As published |
| Western University | Entering class seated fall 2025 | 430 | As published |
| UMKC | Average for accepted students | 420 | As published |
| Columbia | Class entering in 2025 | 24 (headline, old scale) | About 490 |
| UCSF | Class of 2029 | 23.1 (old scale) | About 470 |
| UCLA | Incoming Class of 2029 | 23 (headline, old scale) | About 470 |
| Stony Brook | 2025 entering class | 23 (old scale) | About 470 |
| Rutgers | 2024 entering class | 22 (old scale) | About 460 |
| Ohio State | DDS Class of 2029 | 20.9 (old scale) | About 440 |
These are Academic Averages, except that headline means the school gives a DAT average without calling it that. The last column uses the ADA's table for the nearest whole old score. We quote only figures that schools publish themselves.
The national figures fit this picture. In the 2025-26 CODA survey the average Academic Average across schools was 434, with Perceptual Ability at 432 and Total Science at 436. The survey's school means ran from 370 to 510 with a midpoint of 440, by our count from its table, leaving out one entry of 200 that looks like an error.
An average is not a cutoff. Half the class sits below a median, and classes range widely. Florida's enrolled class ran from 400 to 560 on the Academic Average, and the middle half of Case Western's entering class of 2025 ran from 420 to 462.5. UCSF's Class of 2029 ran from 18 to 28 on the old scale.
Published DAT minimums, and how to read them
A few schools state a floor. Most of these sit well below their class averages, so clearing one only keeps you in the running.
| School | What it states | New-scale figure |
|---|---|---|
| LSU | A target Academic Average of 440, with no single score below 410 | As stated |
| UT Health San Antonio | Academic Average minimum of 390 | 390 |
| Utah | At least 380 in every section | 380 |
| Creighton | Academic Average 370, Perceptual Ability 360, Total Science 380 | As stated |
| Iowa | Academic Average minimum of 360 | 360 |
| UMKC | Academic Average 350 minimum, 370 preferred, 420 average for accepted students | As stated |
| Lincoln Memorial | 19 or better, on the old scale | About 410 on the Academic Average |
| Midwestern, Arizona | Academic Average of 18 or higher desired, on the old scale | About 390 |
Other schools say they have no minimum: Penn, Rutgers and Columbia all state that. Columbia adds that it looks for scores in line with those of its enrolled students, and its class entering in 2025 had a mean of 24 on the old scale. No minimum does not mean any score will do.
Check the section scores as well as the average. Utah's rule covers every section, and LSU looks for no score below 410. Creighton has its own Perceptual Ability and Total Science floors, and UMKC warns that several low section scores will hurt you even when the average clears its minimum.
How to set your own DAT target
List your likely schools
Start with your own state's public school if it has one, then add others. In 2024-25, public dental schools drew 73.9% of first-year students from their own state.
Put every figure on one scale
Copy each school's published average, and note the class and scale. Convert old figures with the ADA's table. If a school publishes none, leave it blank rather than guessing.
Aim at or above the averages you need
Take the highest average among the schools you most want, and use that as your target. Then check that you clear any section minimums.
Weigh your GPA
In the ADA's data, scores and grades predict first-year results best together. If your GPA is under a school's average, a stronger DAT helps, but it cannot stand in for shadowing or an interview.
Set a floor for yourself
Decide before test day what score would make you retest, and what score you would apply with. It is easier to decide calmly in advance.
You live in Ohio, and your list includes Ohio State, Case Western and Penn.
Ohio State's 20.9 is about 440 on the ADA's table. Case Western's mean is 446.75, with a middle half of 420 to 462.5. Penn's is 483.85. A 450 or 460 puts you above the first two averages. Matching Penn's would take a 480 or 490. Your GPA, experience and, at a state school, residency also matter.
Should you retake the DAT?
You must wait 60 days between attempts, and you can test at most four times in any 12 months. From three attempts on, you need permission, and schools see a history of all your attempts.
A retake may make sense if
- Your score is under a published minimum at a school you want.
- It sits well below the averages on your list, and your practice suggests you can do better.
- One weak test pulled your average down, and you know what you would change.
- You have time for 60 days plus three to four weeks for results before your deadlines.
Think twice if
- You are already at or above your schools' averages.
- A school counts only your latest score, and a lower result would then stand in for your higher one.
- You have no new study plan, only hope for a better day.
- A retest would push your application past a school's deadline.
- Your weaker area is really your GPA or your shadowing.
| School | What it says |
|---|---|
| Indiana | Accepts only your most recent scores, whether higher or lower. |
| Creighton | Prioritizes your most recent score. |
| Maryland | Considers your most recent score, and holds your file if your application says you are retaking. |
| UCSF | Will not hold your application for a retake, and reviews it on your current valid scores. |
| Stony Brook | Does not hold applications. |
A retake means the whole test. The ADA does not allow partial testing, so you cannot retake just one section, and you pay the full $580 again. The ADA documents we read give no figures on how much scores change on a second attempt, so be wary of anyone promising a set gain.
If you think your score is simply wrong, you can ask for an audit within 30 days for $105. It rechecks the scoring for accuracy, and takes about four to six weeks.
Good DAT scores: your questions answered
Where this guide's facts come from
Checked against these sources on November 9, 2026. Rules change between cycles, so confirm anything that decides your application on the official page for your entry year.
Turn your score into a school list
Where to Apply turns your GPA, DAT and state into a starting list. If you want to weigh a retake or a change of list with someone, see our strategy calls.